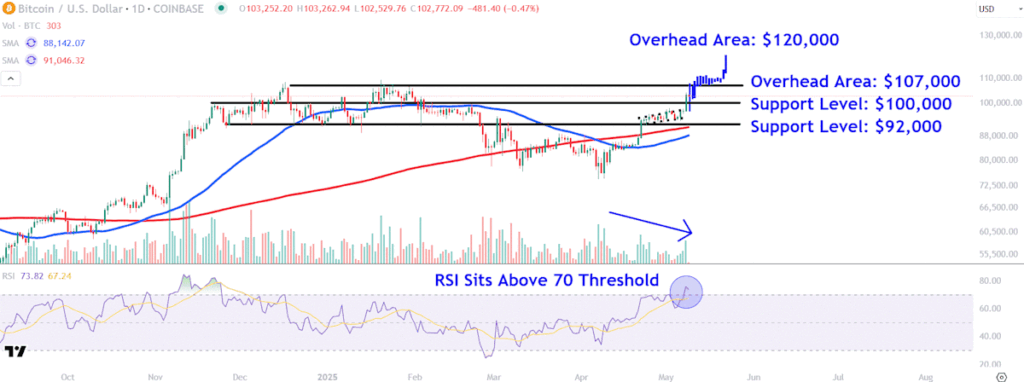
Bitcoin surged above the closely watched $100,000 level on Thursday for the first time since early February.
Thursday’s strong breakout above a consolidation period sets the stage for a potential retest of the cryptocurrency’s record high of $109,000 set in late January.
Investors should watch crucial overhead areas on bitcoin’s chart around $107,000 and $120,000, while also monitoring key support levels near $100,000 and $92,000.
Bitcoin (BTCUSD) will remain in the spotlight Friday after surging above the closely watched $100,000 level on Thursday for the first time since early February.
The legacy cryptocurrency rallied along with stocks after President Donald Trump announced that the U.S. had reached a trade agreement with the U.K. The president also said that further deals could be on the way and expressed optimism about trade talks with China that are slated to take place this weekend.
Bitcoin’s price had fallen sharply between February and April, weighed down by uncertainty about tariffs and their potential impact on the economy, as well as disappointment with the pace of reforms by the Trump administration to support the crypto industry. With the latest surge, bitcoin is nearly 40% above last month’s low and up 10% from the start of the year.
Bitcoin was trading at $102,700 late Thursday evening, up from an intraday low of around $96,000.
Below, we take a closer look at Bitcoin’s chart and apply technical analysis to identify crucial price levels worth watching out for.
After reclaiming the 200-day moving average (MA) last month, bitcoin traded within a narrow consolidation period before today’s strong breakout above the all-important $100,000 mark. The move sets the stage for a potential retest of the cryptocurrency’s record high established at $109,000 in late January.
Meanwhile, the relative strength index confirms bullish price momentum with a reading above the 70 threshold, though the indicator also cautions overbought conditions that could lead to short-term profit-taking.
It’s important to note that trading volumes on Coinbase (COIN), the largest crypto exchange in the United States, have declined since bitcoin’s move higher started in early April, indicating larger market participants may be sitting out the current rally.
Let’s identify two crucial overhead areas on bitcoin’s chart worth watching while also locating key support levels to monitor.
The first overhead area to watch sits around $107,000. This location will likely attract significant attention near the prominent December and January peaks that marked a double top pattern on the chart.
Story Continues


